An Attention-Based Multi-Input Network for EGFR Inhibitors
Training structure and chemistry in one model, and getting an explanation out of it
A few years after the Angel’s trumpet work, I was doing the same kind of question — which molecules are active, and why — with a GPU instead of a separatory funnel. This post introduces the paper I wrote with Trung Hoang Le: Attention-based Multi-Input Deep Learning Architecture for Biological Activity Prediction: An Application in EGFR Inhibitors published at the 2019 11th International Conference on Knowledge and Systems Engineering (KSE). Code is at lehgtrung/egfr-att.
The problem with training features separately
A molecule can be described two ways, and they carry different information.
You can describe its structure — the atoms, the bonds, the rings — usually as a fingerprint vector or, as we did, straight from the SMILES string. Or you can describe its chemistry — logP, dipole moment, the thousand-odd computed molecular descriptors that summarise how the whole molecule behaves.
Studies had already established that combining both helps. But the way it was done was: train one model on structure, train a second model on descriptors, then feed both outputs into a third model that makes the final call. That works, and it is also awkward. Every feature set needs its own algorithm, so you cannot build one pipeline; you build three and hope they stay in sync. The models never see each other during training.
Our question was simply: what if both go into one network, trained at once?
The second problem was interpretation. A neural network that says 0.87, inhibitor and nothing else is hard to use in medicinal chemistry, where the actionable question is which part of the molecule you should keep and which part you should change.
The architecture
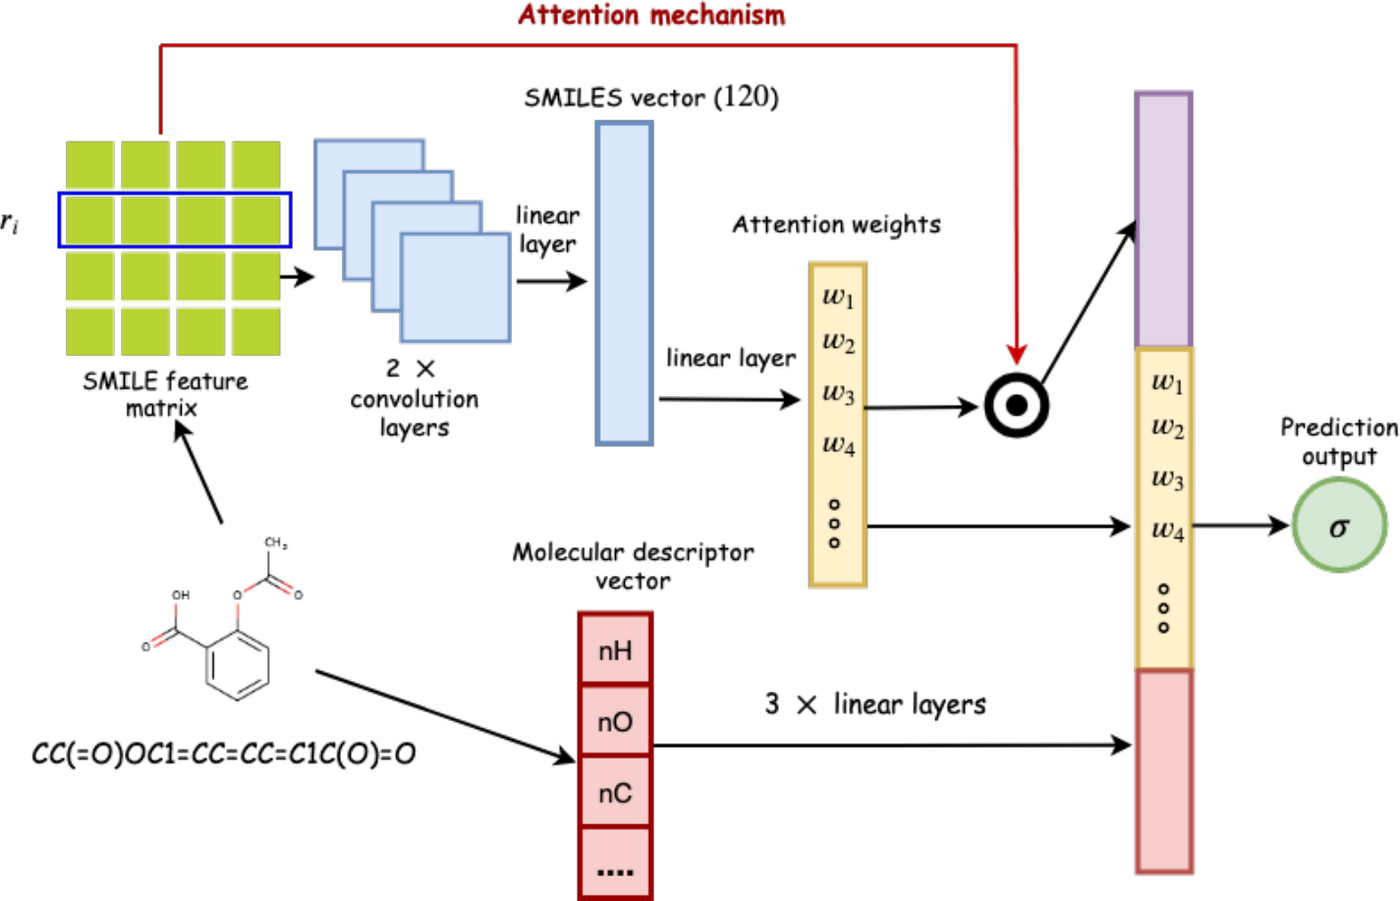
Two branches meeting at a concatenation.
The CNN branch takes structure. Each SMILES string is encoded as a matrix using M. Hirohara’s scheme: one row per character, padded to 150 rows, and 42 features per row — 21 describing the atom (element, attached hydrogens, degree, charge, valence, ring membership, aromaticity, chirality, hybridisation) and 21 describing SMILES syntax (brackets, bonds, branch markers, start and end). That matrix goes through two convolution blocks — conv2d, batch norm, dropout, max pool — and a linear layer.
The MD branch takes chemistry. 1613 two-dimensional descriptors computed with mordred,
cleaned of constant and meaningless columns, standard-scaled, then three fully connected blocks
narrowing 512 → 128 → 64.
The attention layer sits on the structural branch. Let $R_i$ be row $i$ of the SMILES feature matrix — that is, one atom — and $\vec{m}$ the vector coming out of the CNN branch’s linear layer. The attention weight for that atom is the similarity between the two, squashed:
\[a_i = \frac{1}{1 + \exp(R_i \cdot \vec{m})}\]and the layer’s output is the weighted sum $\vec{f} = \sum_i a_i R_i$.
The point is that $a_i$ is a number attached to a specific atom. You can read it off after training and ask the model which atoms it was looking at.
Then $\vec{f}$, $\vec{m}$ and the descriptor vector $\vec{t}$ are concatenated, passed through one linear layer, and squashed by a sigmoid into the probability that the compound inhibits EGFR.
The data
EGFR — the epidermal growth factor receptor — is a tyrosine kinase whose dysregulation drives several cancers, lung cancer especially, which makes it one of the most-studied targets in oncology.
We used H. Singh et al.’s dataset: 3492 compounds labelled inhibitor or non-inhibitor at an IC50 threshold of 10 nM. The ratio is 506 inhibitors to 2986 non-inhibitors, about 1 : 6, so the class imbalance is real and the metric choice matters. Singh’s Random Forest model on the same data is the baseline we had to beat.
Everything was implemented in PyTorch, tuned by grid search, and evaluated by 5-fold cross-validation with early stopping at 30 epochs of rising loss. The winning configuration: batch size 128, dropout 0.5, ADAM, learning rate 1e-5, decision threshold 0.2.
Results
We report MCC as the primary metric. Accuracy and F1 both ignore parts of the confusion matrix, and on a 1 : 6 split that is how you fool yourself; MCC uses all four cells.
| Metric | H. Singh et al. | CNN only | CNN + MD | CNN + MD + ATT |
|---|---|---|---|---|
| Sensitivity | 69.89% | 74.31% | 75.29% | 74.11% |
| Specificity | 86.03% | 85.77% | 89.75% | 90.15% |
| Accuracy | 83.66% | 84.10% | 87.66% | 87.83% |
| MCC | 0.49 | 0.50 | 0.58 | 0.57 |
| AUC | 89.00% | 87.52% | 90.32% | 90.84% |
| Loss | — | 0.2727 | 0.2434 | 0.2399 |
| Running time | — | 59 min | 31 min | 37 min |
Three things in that table are worth pulling out.
Structure alone is not enough. The CNN-only model barely matches the Random Forest baseline and is actually worse on AUC. Our reading is sparsity: padding every SMILES string out to 150 rows leaves a mostly-empty matrix, and a sparse input needs more data than 3492 compounds to train on.
Adding the descriptor branch fixes it. MCC goes 0.50 → 0.58, AUC 87.5% → 90.3%. The second input gives the network information it can use immediately, rather than having to extract it from a sparse matrix.
And it trains faster. The bigger model takes half the time of the small one — 31 minutes against 59. The sparse-input model needs many more epochs to converge; when the descriptor branch is there, information appears to flow between the branches and the loss settles much sooner. That was the result that surprised us most, and it is exactly what the train-each-feature-set-separately approach throws away.
What the model looks at
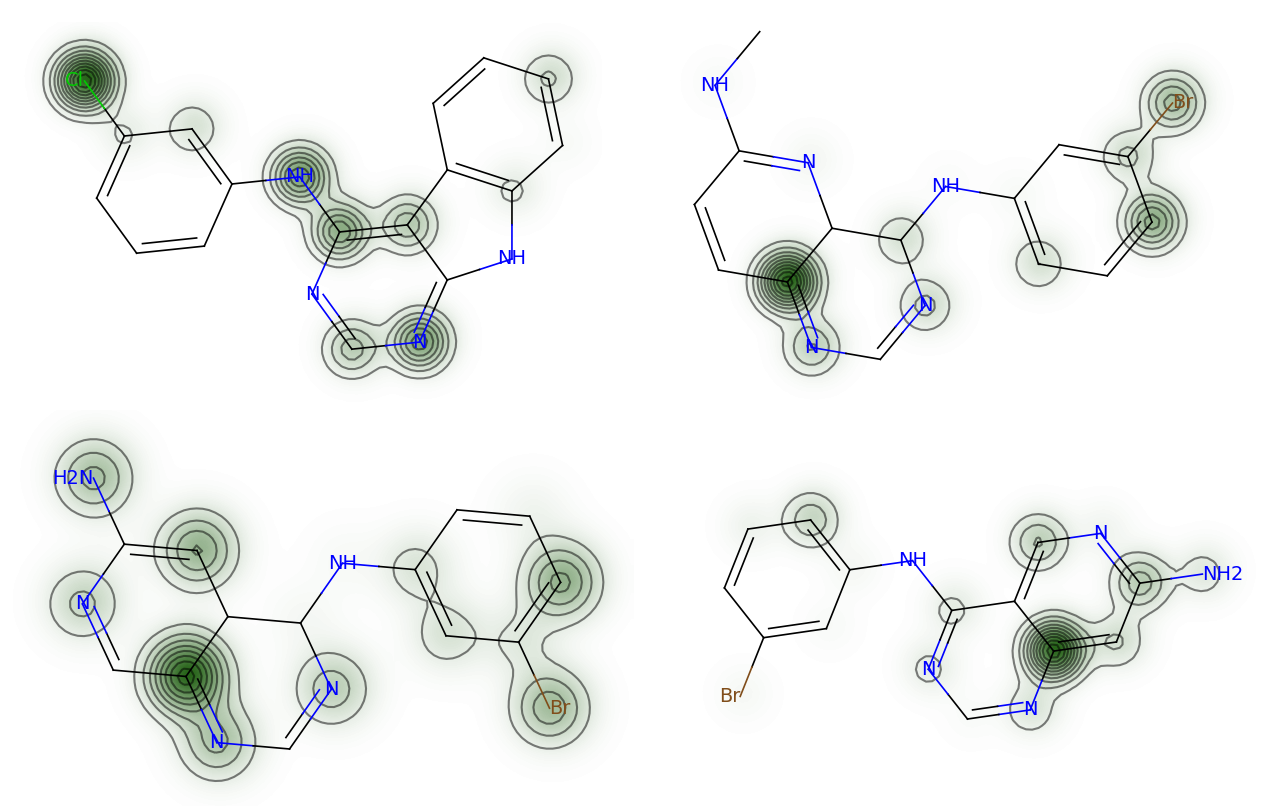
Attention weights, one per atom, rendered over the structure with rdkit. Darker means the
model weighted that atom more heavily.
Two patterns show up across compounds: nitrogens in heterocyclic rings are consistently highlighted, and halobenzyl substitution on a heterocycle contributes positively to predicted activity. Both are recognisable to anyone who has looked at this chemical series — which is the point. The model is not being asked to teach us new pharmacology here; it is being asked to show that its confidence rests on the parts of the molecule that ought to matter.
Note that attention cost us nothing on MCC (0.58 → 0.57) and gained a little on AUC and specificity. We did not tune the attention model hard, because interpretability was what we wanted from it.
Limitations
Attention is per-atom, so functional groups are invisible. Each row of the feature matrix is one atom, weighted independently. A carbonyl or a carboxylic acid is a unit chemically, but the model has no way to say so. The fix we proposed is a third branch embedding substructure patterns — ECFP, or a hashed fingerprint — so groups can carry weight as groups.
The dataset is small for deep learning. 3492 compounds, and the CNN-only result shows what that costs when the input is sparse.
Attention did not improve accuracy. It bought interpretation, not performance. Whether tuning it properly would change that, we did not find out.
Huy Ngoc Pham, Trung Hoang Le. “Attention-based Multi-Input Deep Learning Architecture for Biological Activity Prediction: An Application in EGFR Inhibitors”. In 2019 11th International Conference on Knowledge and Systems Engineering (KSE), IEEE, 2019. Preprint: arXiv:1906.05168. Figures reproduced from the paper. Implementation: github.com/lehgtrung/egfr-att.